Community driven population health improvement efforts that include a health equity lens as well as cultural competence in their programs and initiative work to address population health issues. Through a community driven, collaborative approach, essential stakeholders as well individual citizens provide valuable insight, data, research, ideas for ways to address the population health issues, funding, and gives the stakeholders more of a stake and ownership of the programs and initiative. When health equity is taken into account, programs and initiatives can be designed to provide additional help those who may be at a higher risk of a certain issue or at more of a disadvantage in some way than others in the same community. Looking at examples of real-world examples of a community driven, health equity focused population health improvement efforts can provide better understanding of and ideas for practical ways to do this in one’s own community.
The Sitka Health Summit’s healthy food programs are a one example to of a community driven population health improvement programs that include a health equity lens.
The Sitka Health Summit, is an ongoing, community driven population health improvement annual event that started in 2008 in the small, coastal town of Sitka, Alaska (population 8,863 as of 2015). The Summit was began through a partnership between Sitka’s two hospitals. Local citizens identify and decide on two health initiatives to work on in the next year during the Summit. Each initiative is then funded with a $2,000 grant with the funding for the grant provided by the two hospitals as well as other community organizations. At many of the Summits, health issues relating to lack of access to and consumption of healthy food was recognized as a major challenge.
Factors such as Sitka’s relatively remote location in a cold climate meant that a lot of foods had to be imported in, thus increasing the cost of healthy foods like oranges as well as food overall. For example the average family food cost per week in Sitka is higher than in other communities in Alaska such as Juneau and Anchorage, as well as higher than that of the US average. As a result, several healthy food programs were developed, beginning with the Sitka Local Foods Network. Several interesting and innovative healthy foods programs have come out of the Sitka Health Summit’s annual initiatives.
The healthy food programs include finding ways to improve access to both healthy, fresh locally -grown foods as well as traditional, healthy Tlingit food because of their focus on food as important for nutrition as well as having cultural importance. The Tlingit are the Alaska native people who have inhabited the Sitka, Alaska area for a long time. The healthy food programs in Sitka include The Sitka Local Foods Network, St. Peter’s Fellowship Farm, Sitka Farmer’s Market, Garden Mentoring Program, Sick-A-Waste Sitka Composting Project, the Sitka Kich, serving local fish in school lunches, Stream to Plate Fish to School Classroom Lessons, and an annual Sitka Seafood Festival.
Sitka Local Foods Network
This is a nonprofit organization whose mission is to increase the amount of locally produced and harvested food in the diets of Southeast Alaskans that began as a result of the first Sitka Health Summit in 2008 as a way to tie two, healthy food initiatives together: creation of a community garden and greenhouse as well as a farmer’s market. It has since then expanded it’s programs to include expanding community and family gardens, providing educational opportunities, technical expertise and encouragement, Promoting the responsible and sustainable use of traditional foods, also called subsistence foods, and conducting a community food needs assessment in 2012.
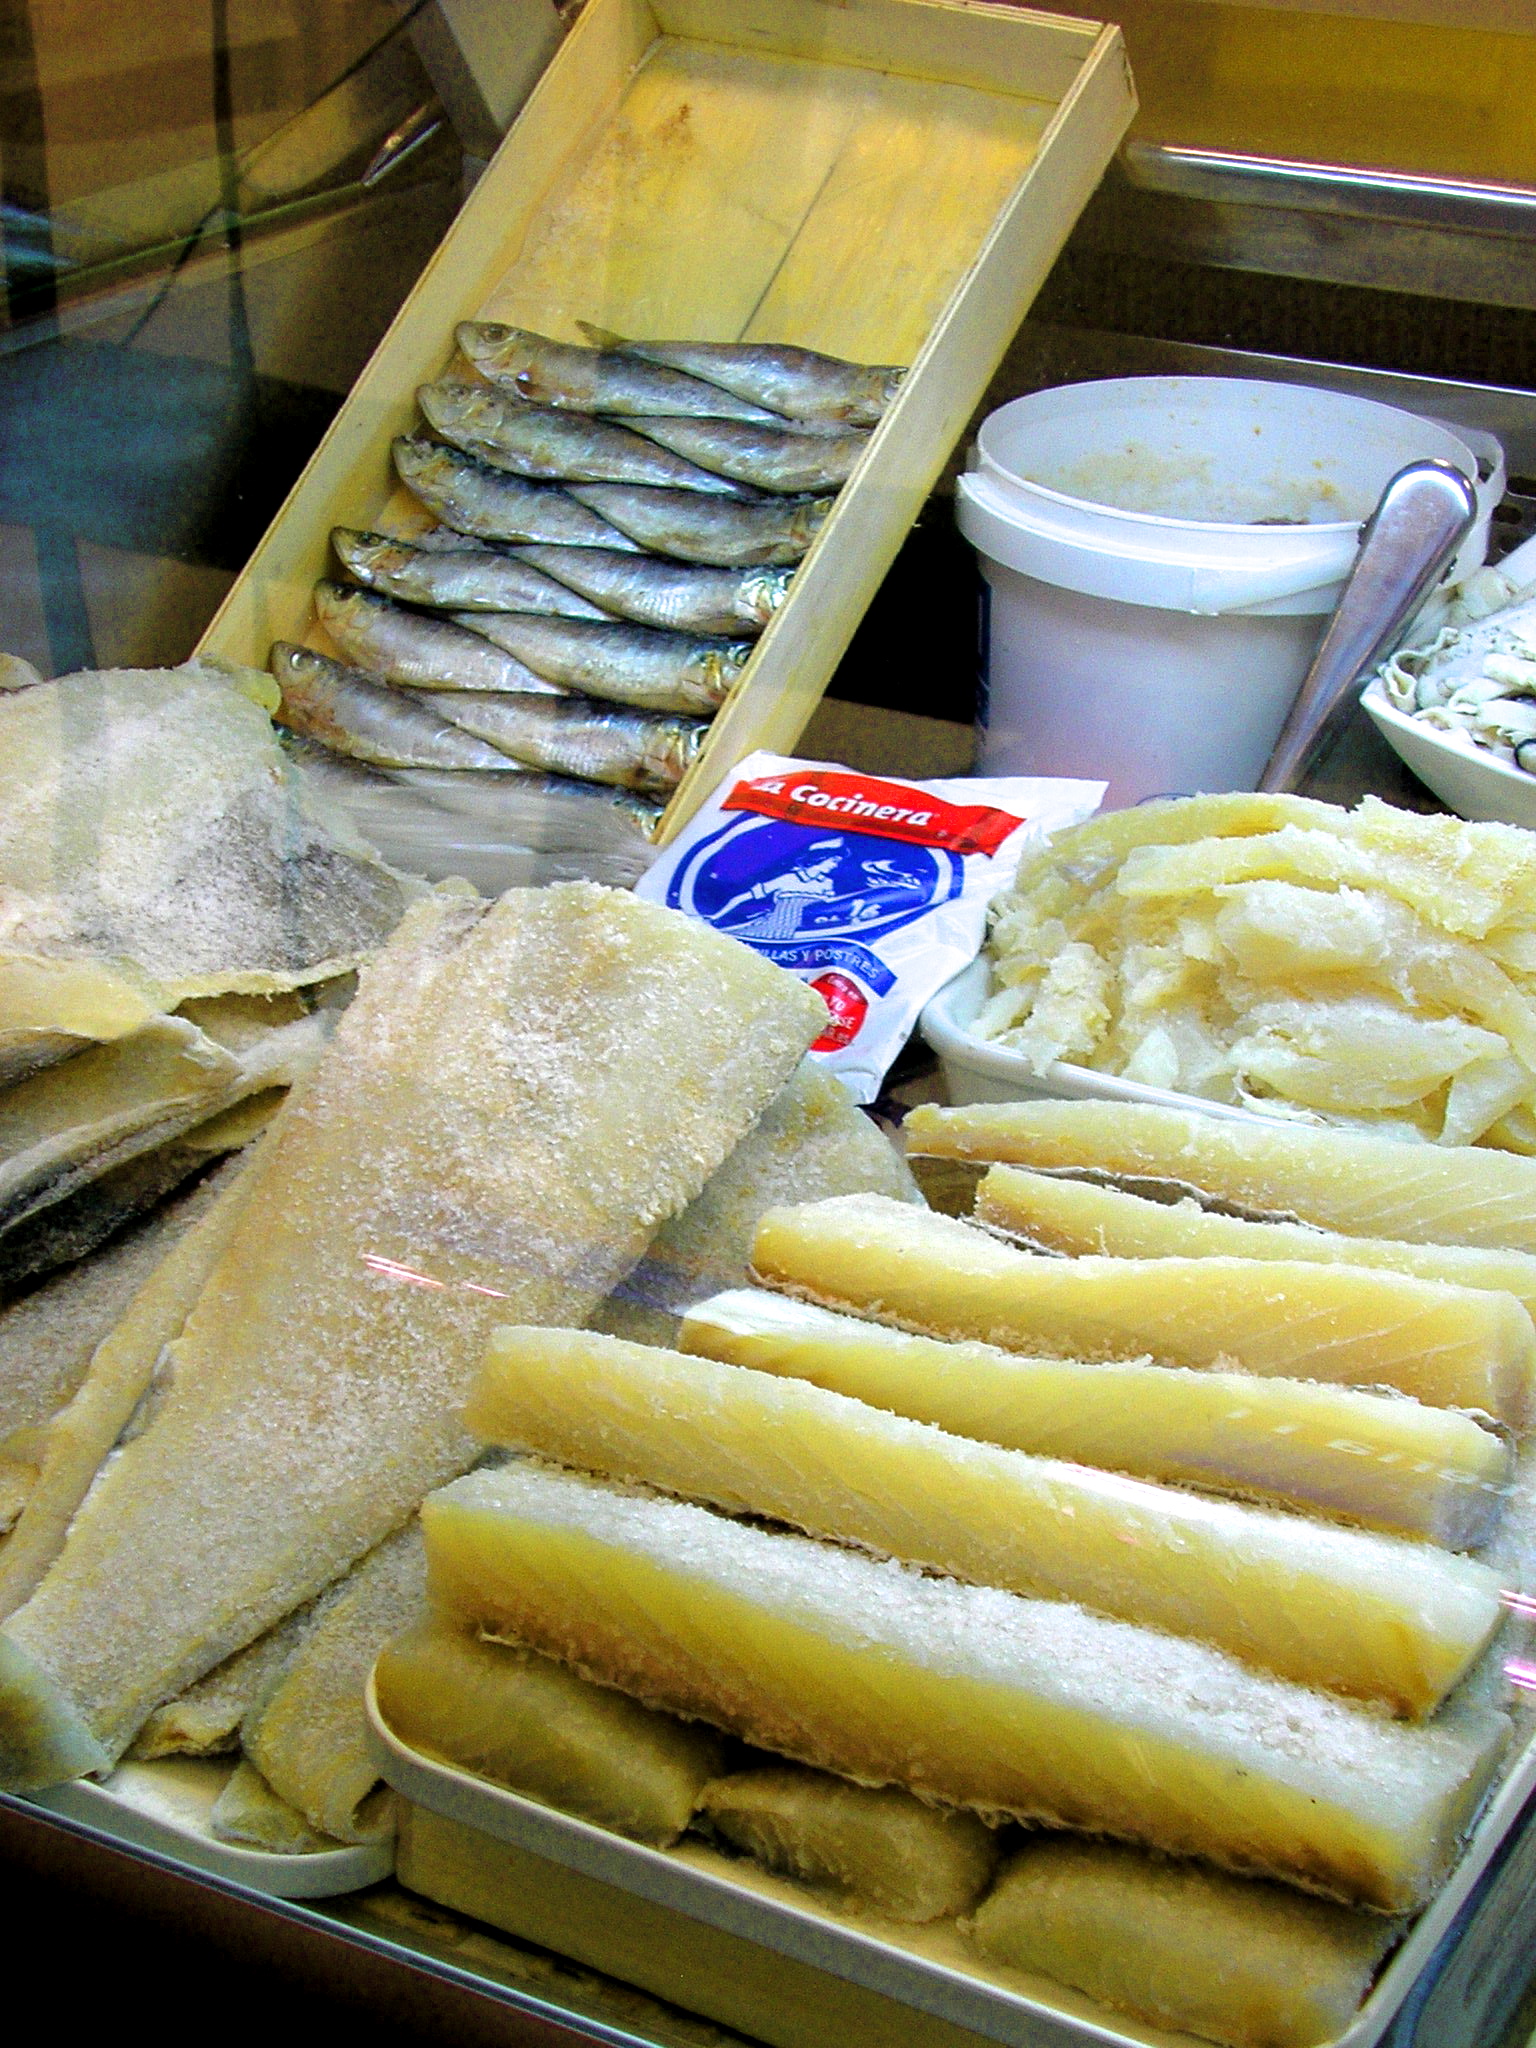
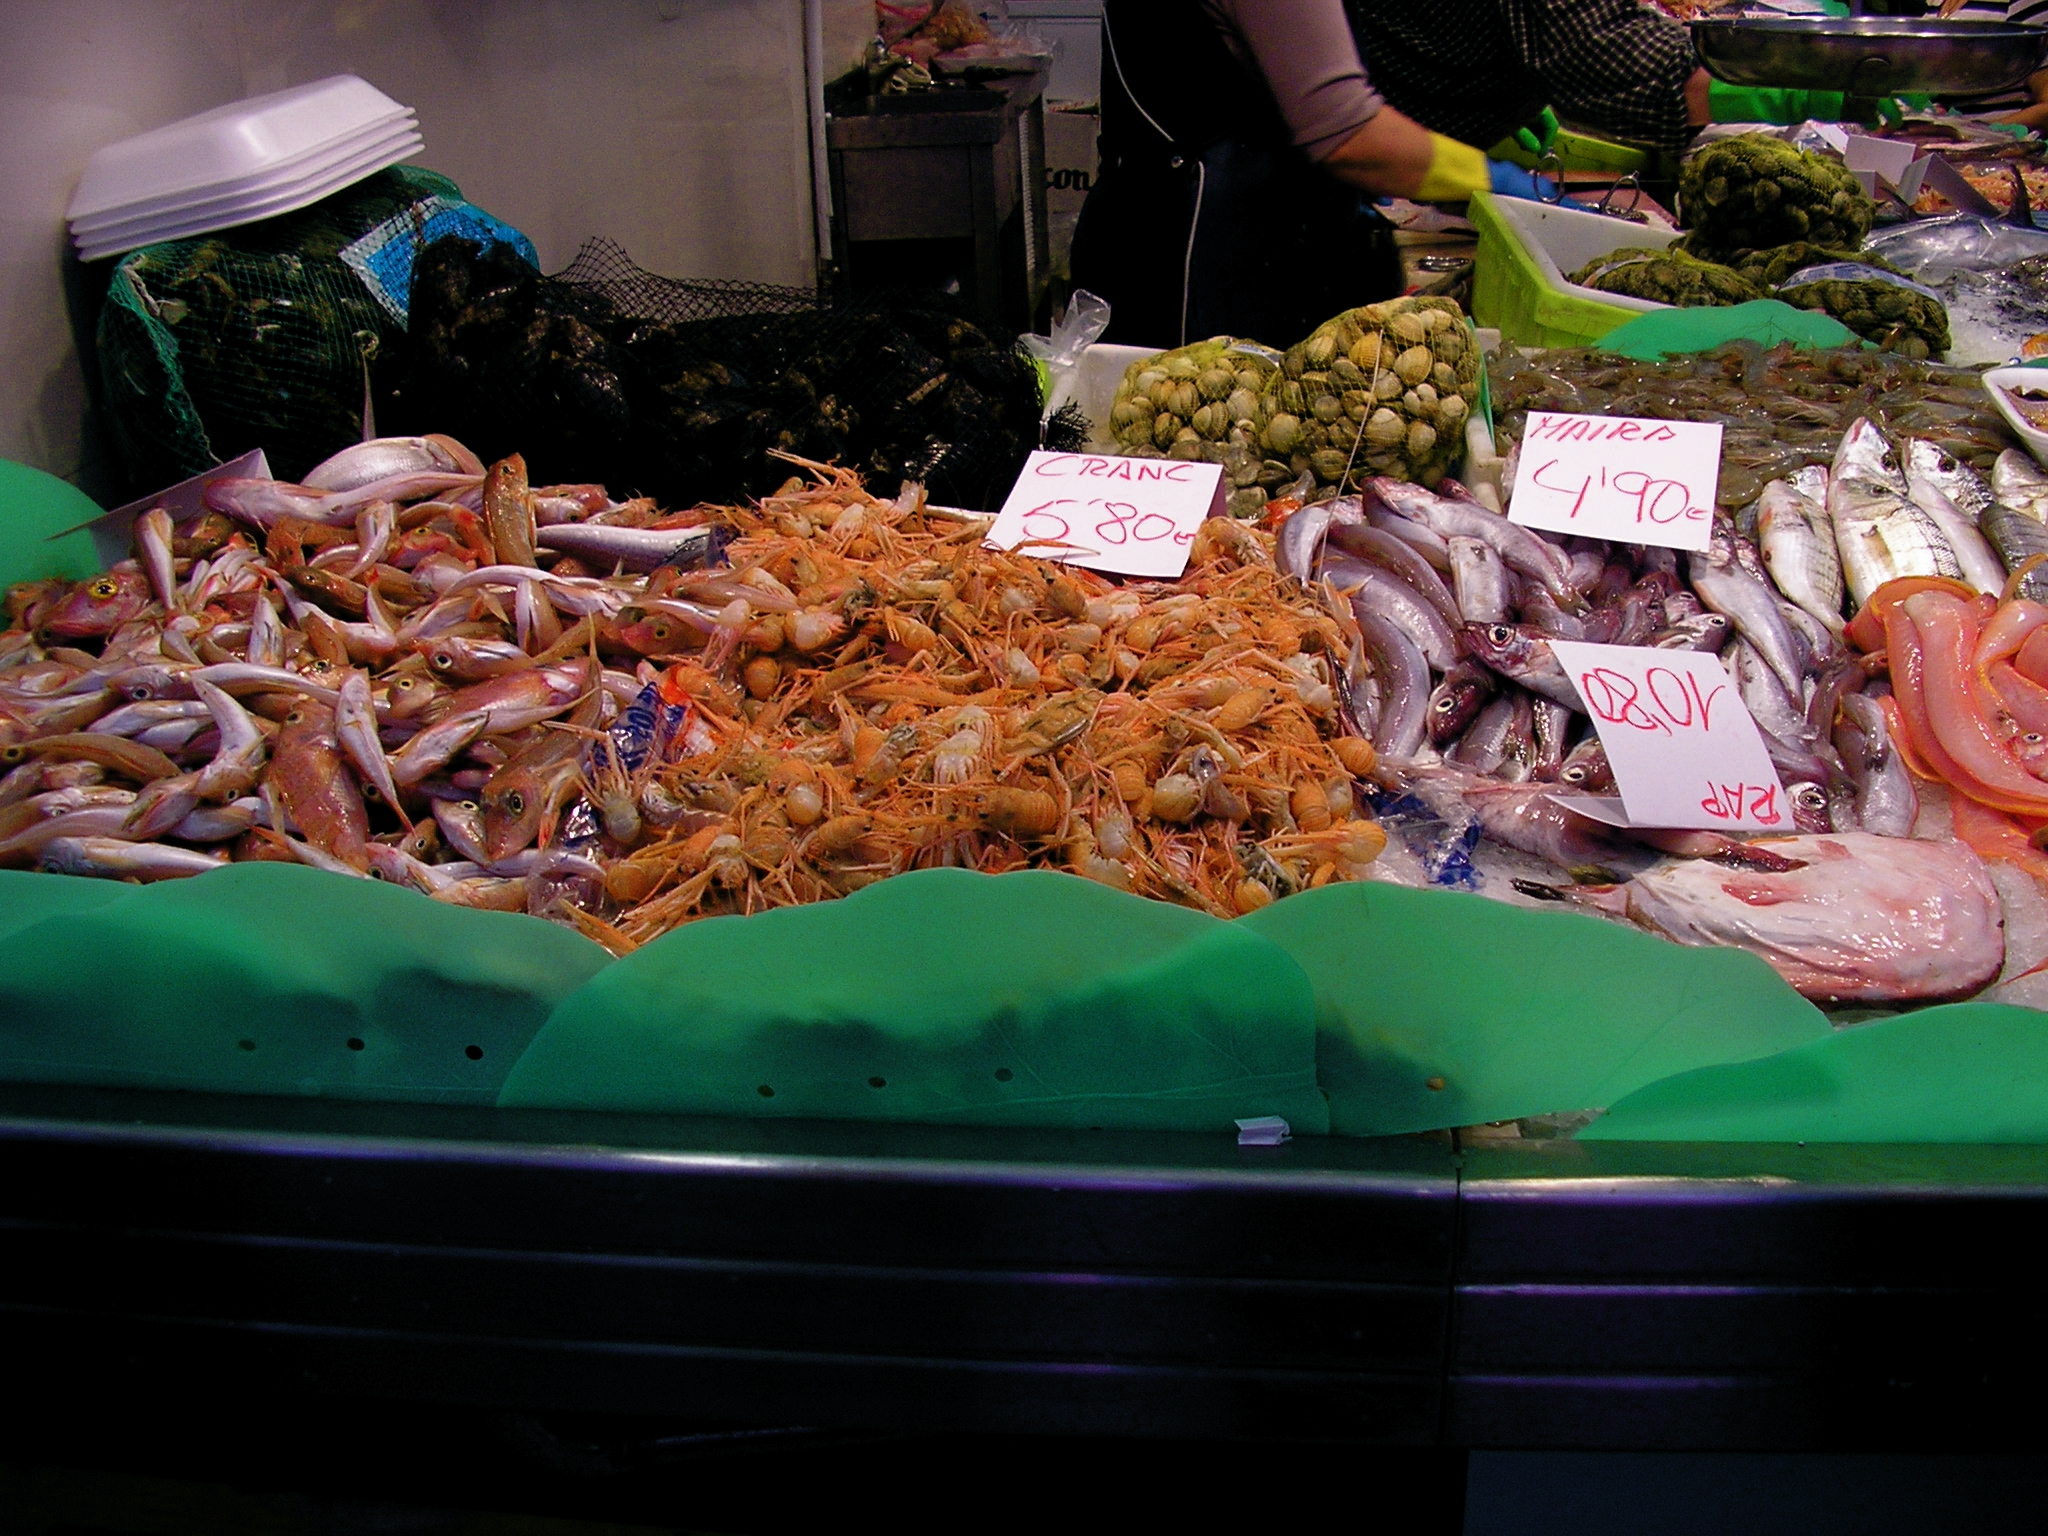
Throughout their programs, the food network takes into consideration health equity as well as cultural competence. For example, they try to provide assistance so that those in the community who may be at a economic disadvantage can also participate in and purchase healthy, local produce. Also, their promotion of sustainable use of traditional or subsistence foods includes collaborating with the Alaska Native communities to promote foods such as local salmon, halibut, cod, herring eggs, deer, berries, seaweeds and other foods that were traditionally consumed by the Tlingít, Haida and Tsimshian diets before non-Native Alaskans arrived in Sitka.
St. Peter’s Fellowship Farm
This community farm was created in partnership with the Sitka Local Foods Network and St. Peter’s By-The-Sea Episcopal Church. Community members organized by the Sitka Local Foods Network built raised garden beds on the church’s land. Local contractors provided the soil. Engaging people from all different sectors of the community was an important aspect of the project, involving different groups, like elementary school students who were involved with planting, weeding, harvesting some of the crops. Celebrated. The opening of the farm was celebrated a big community potluck, featuring healthy produce from the gardens.
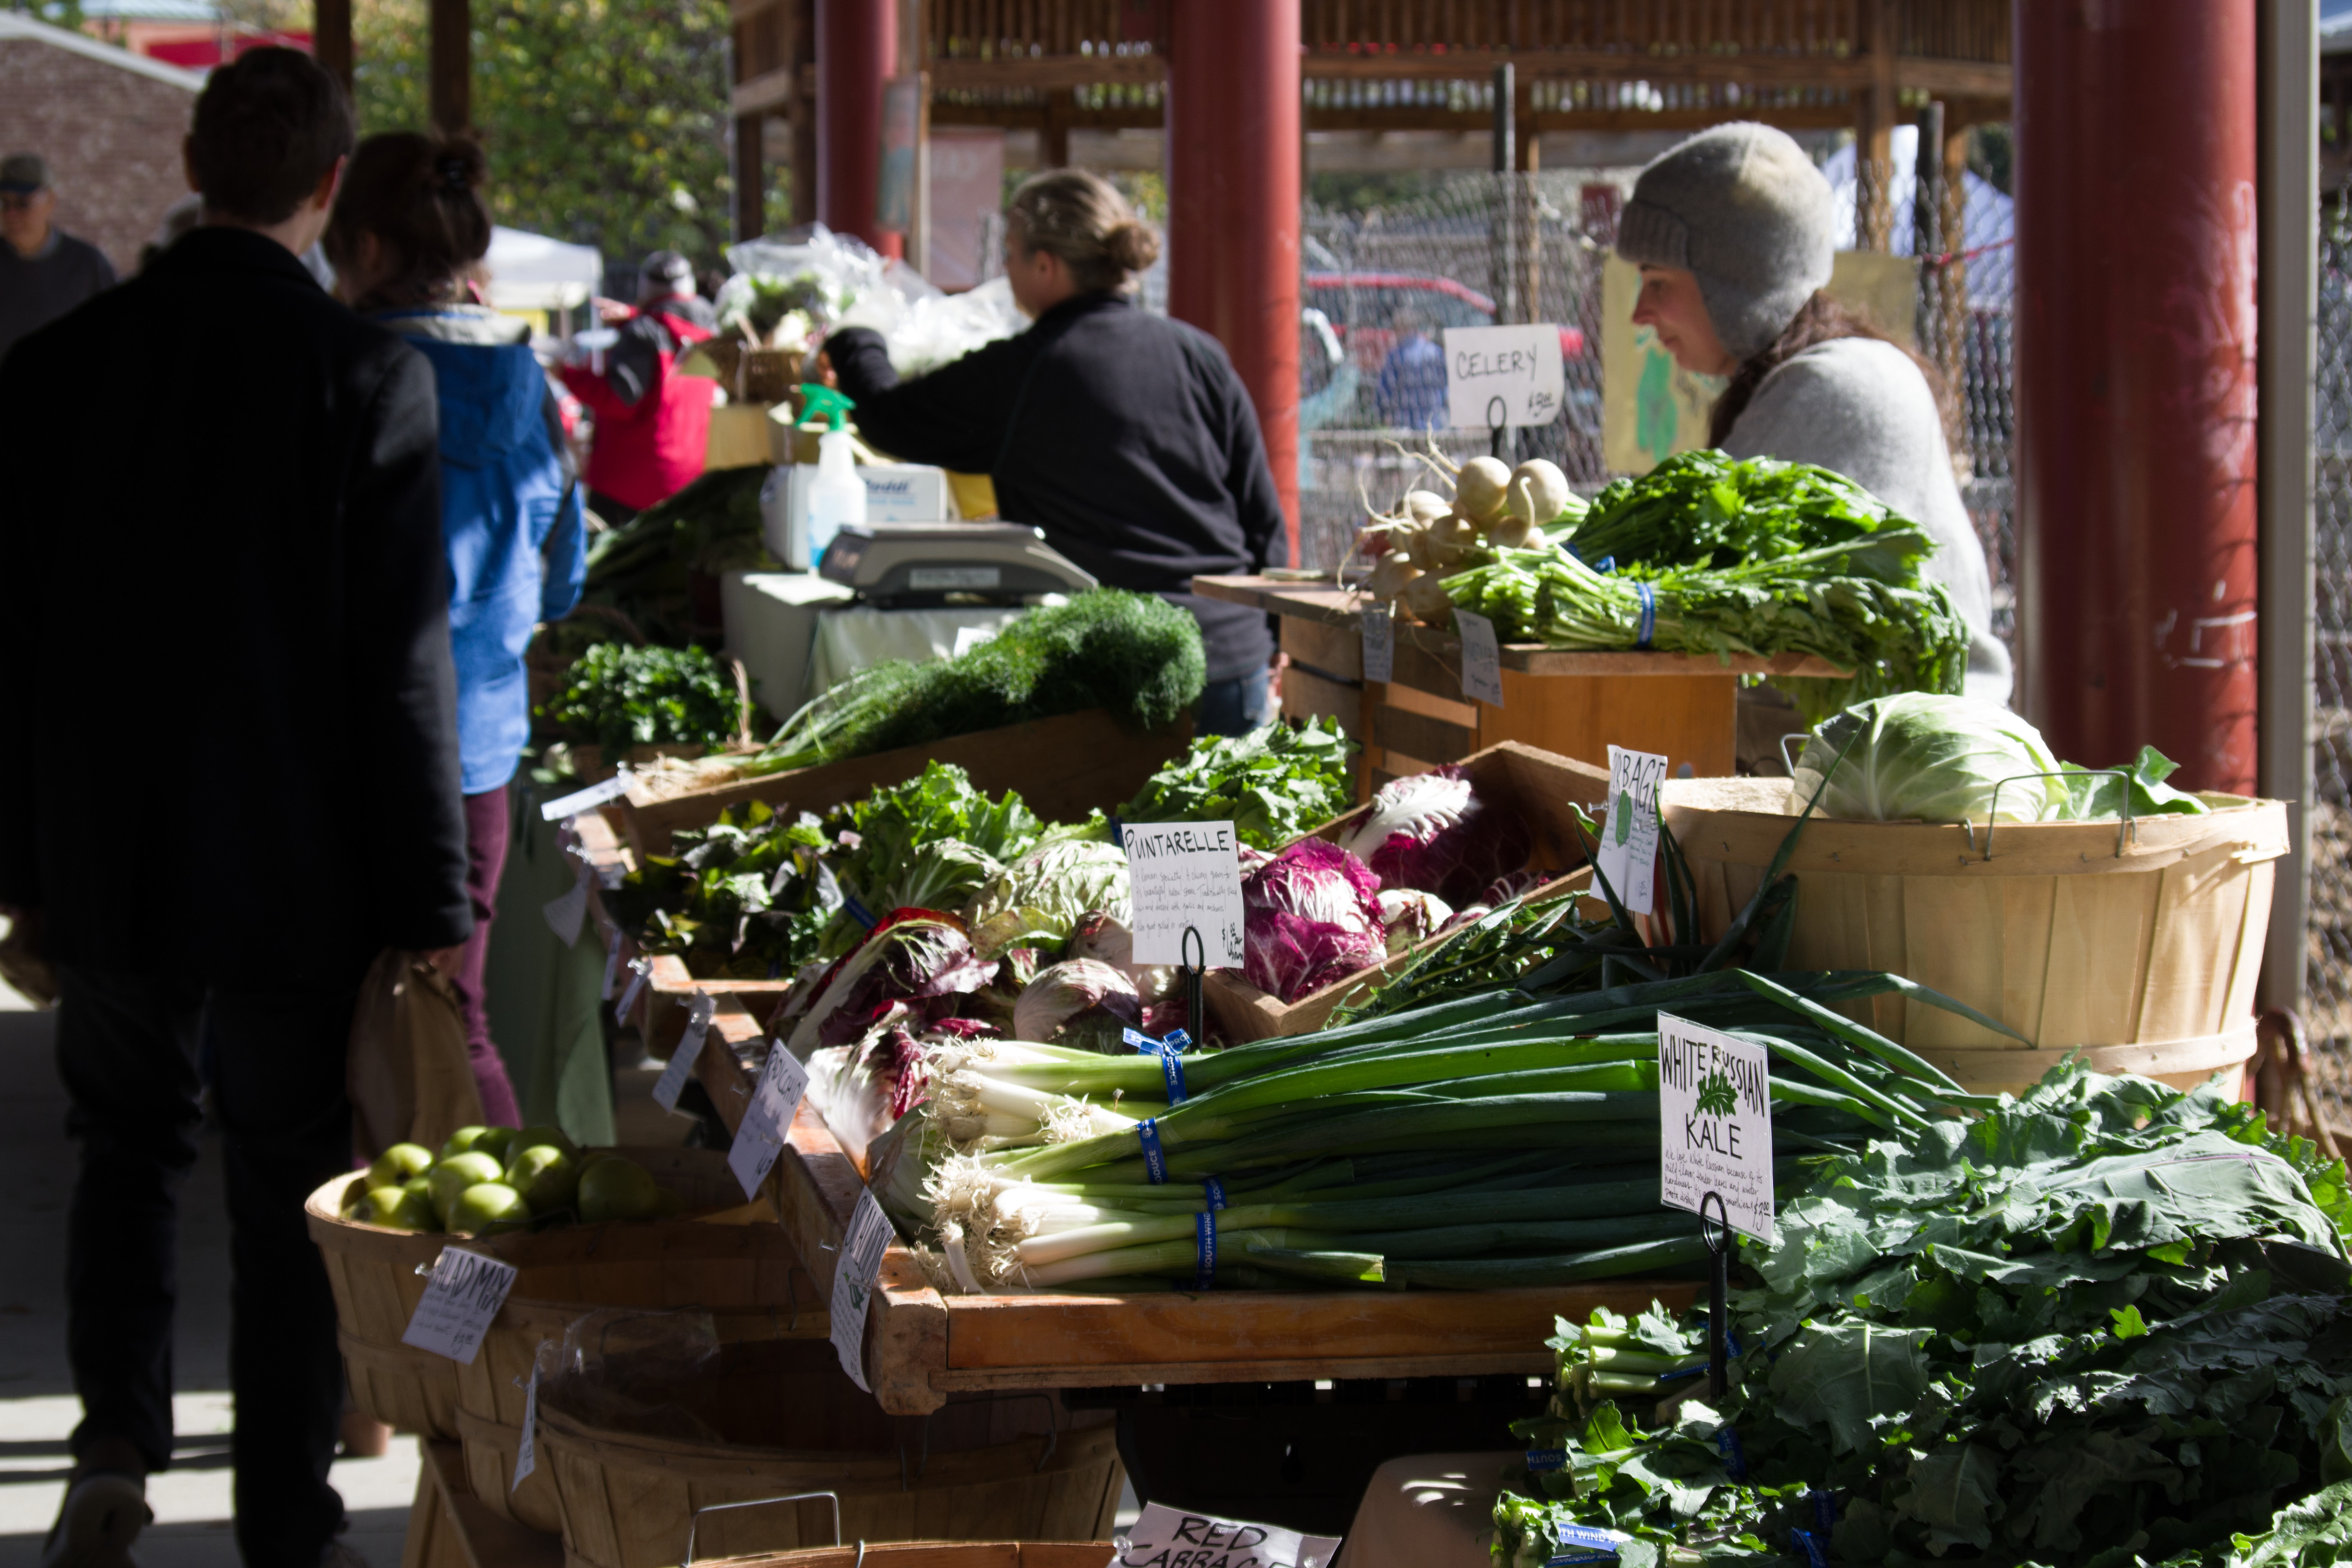
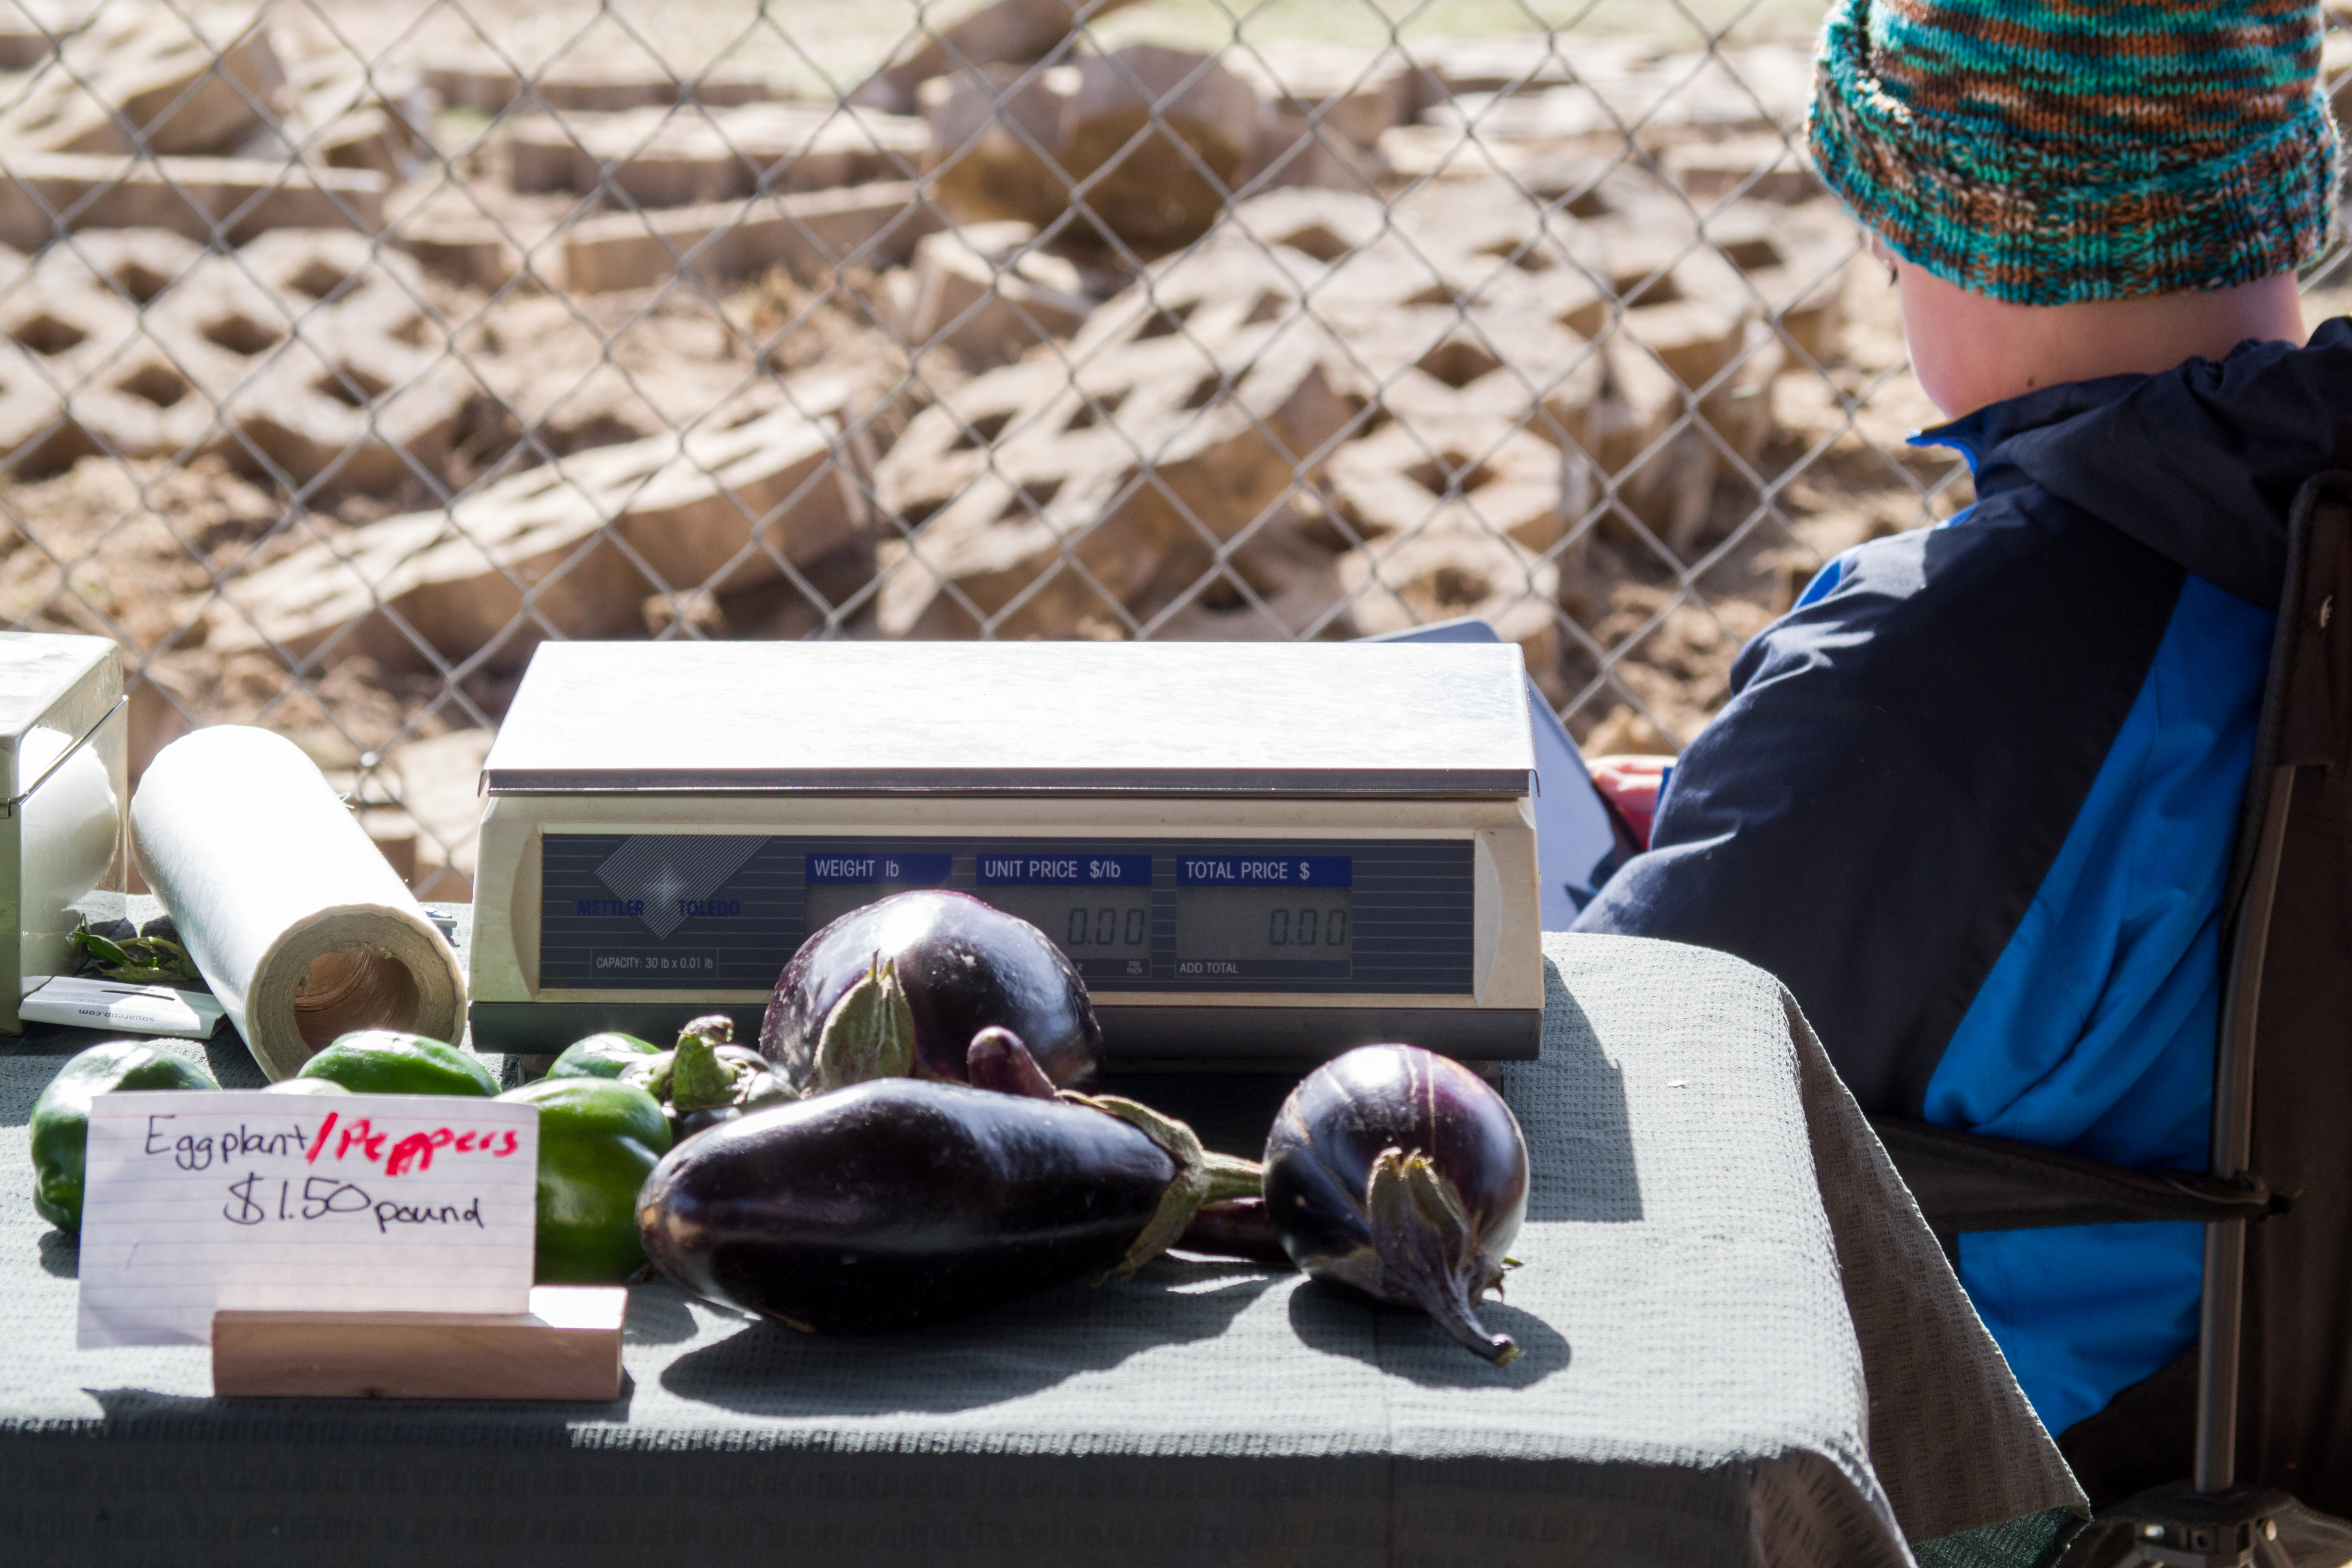
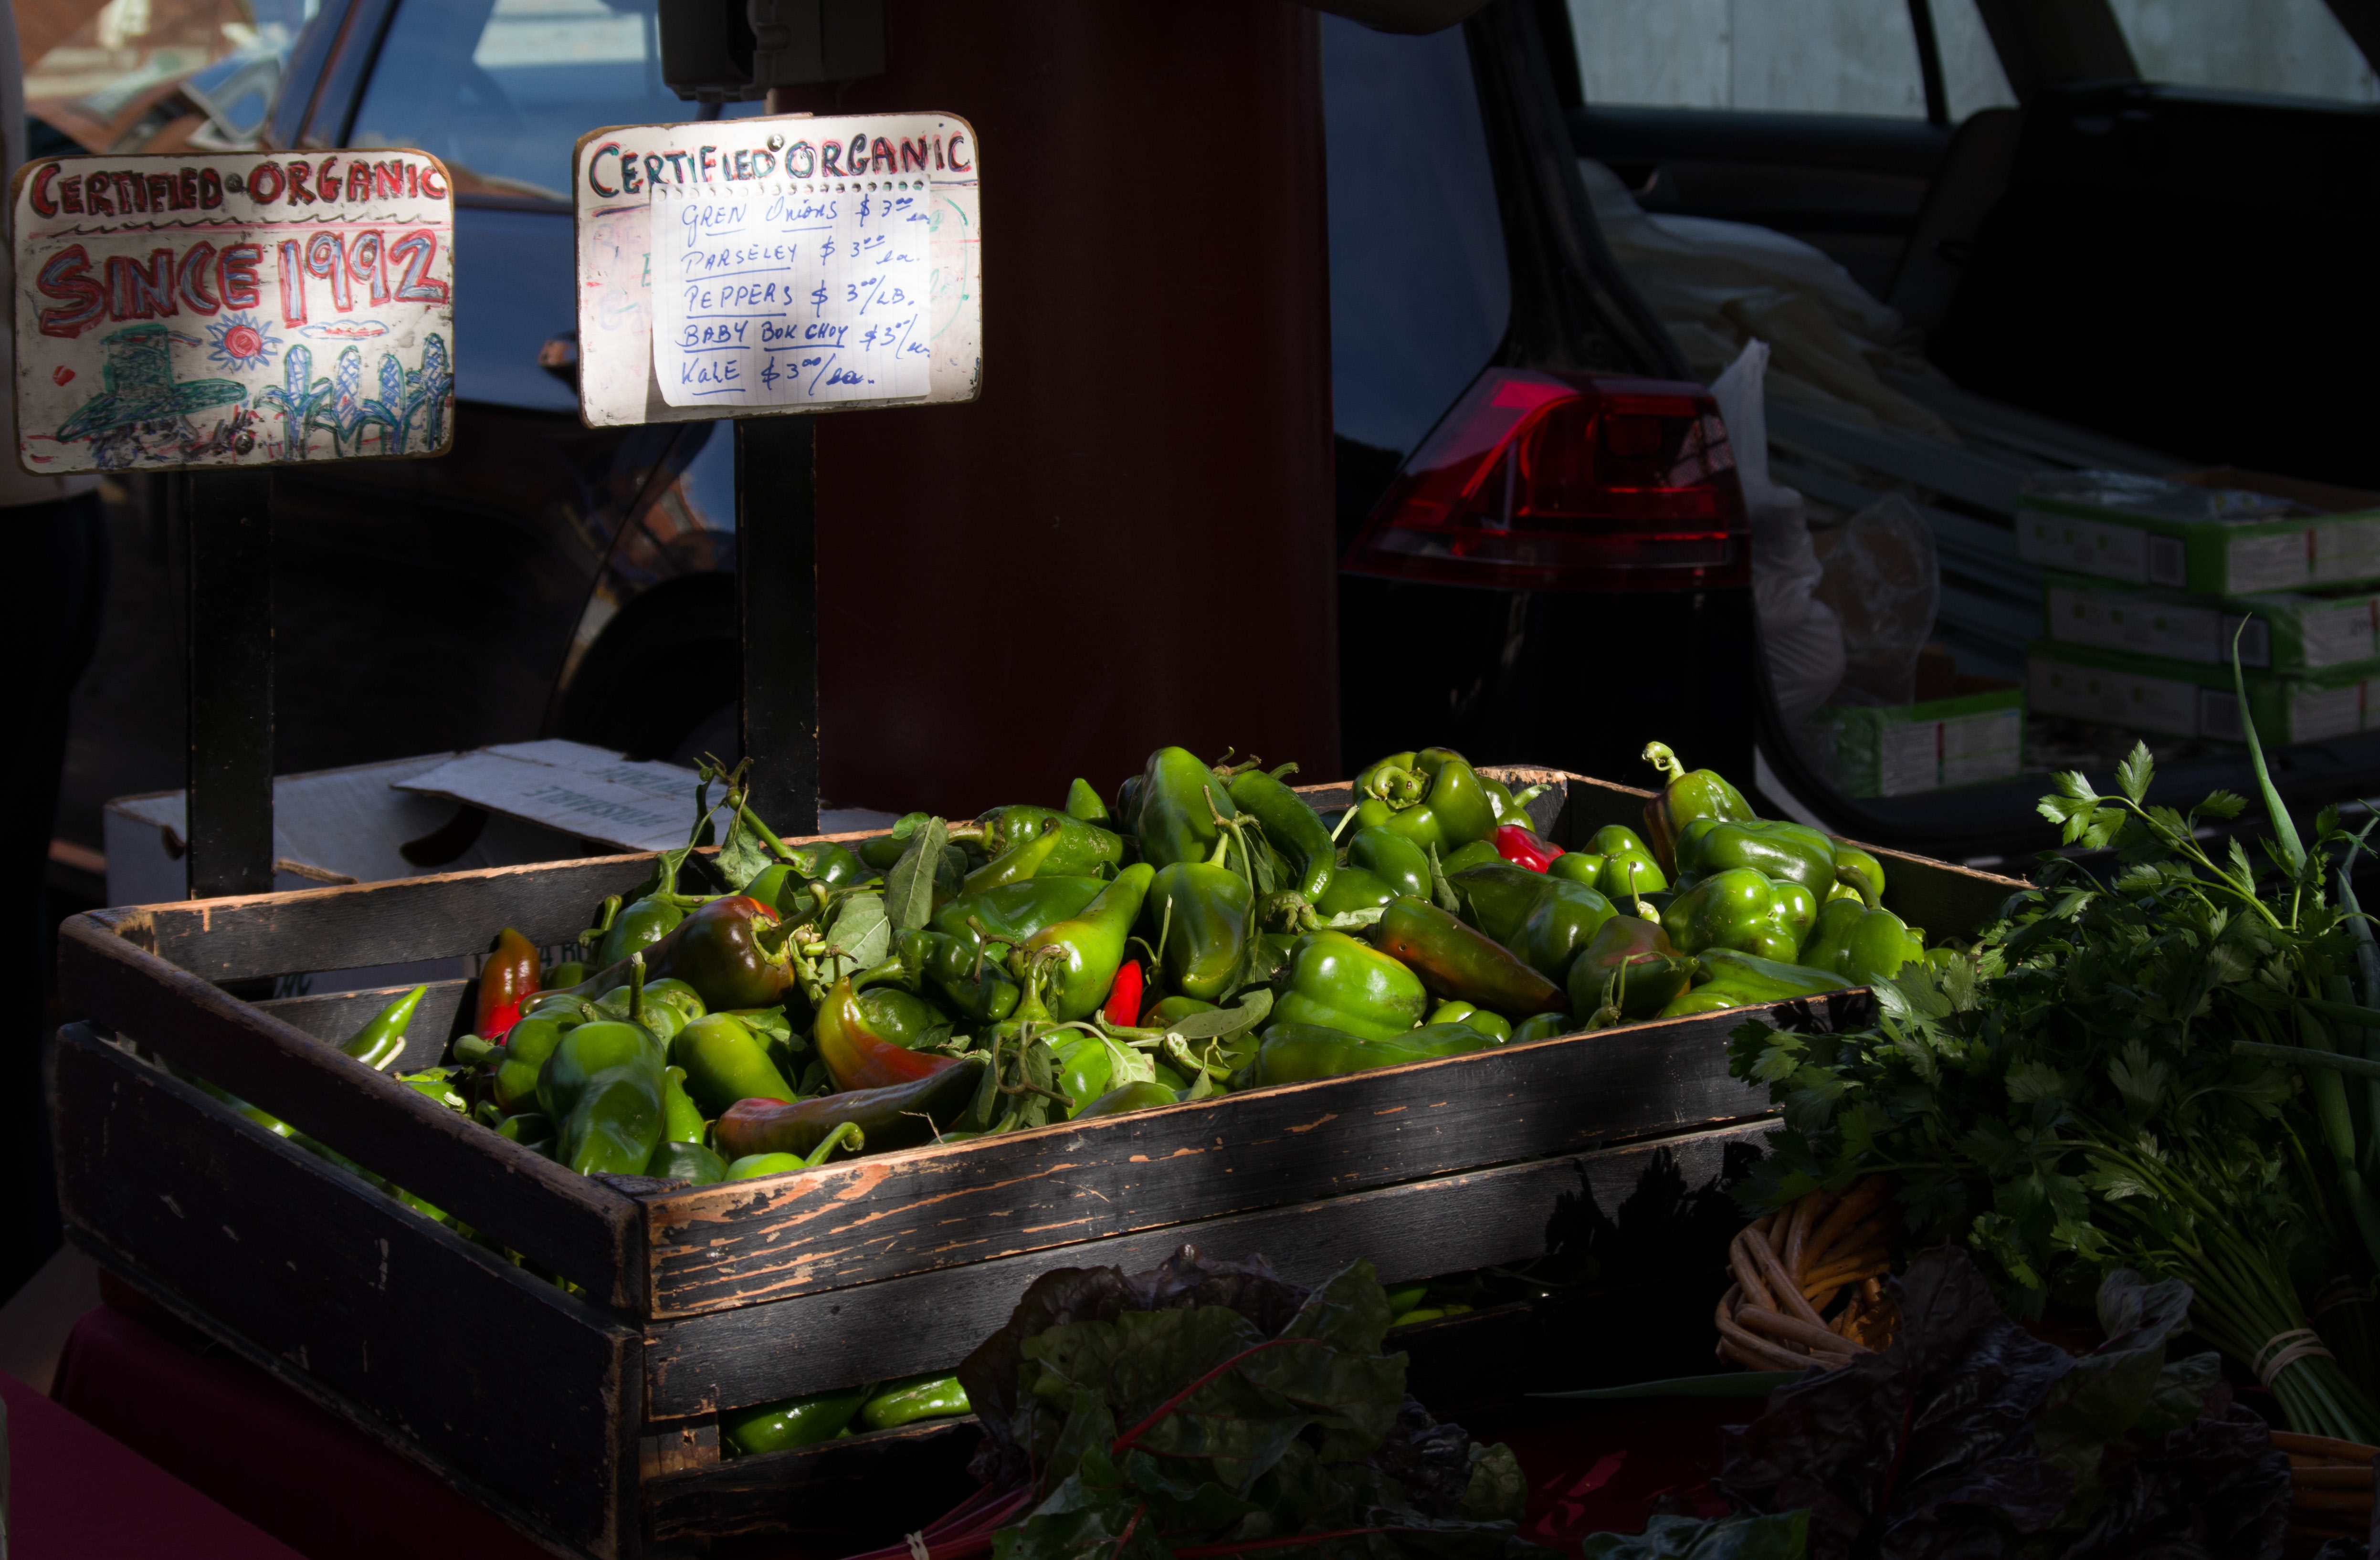
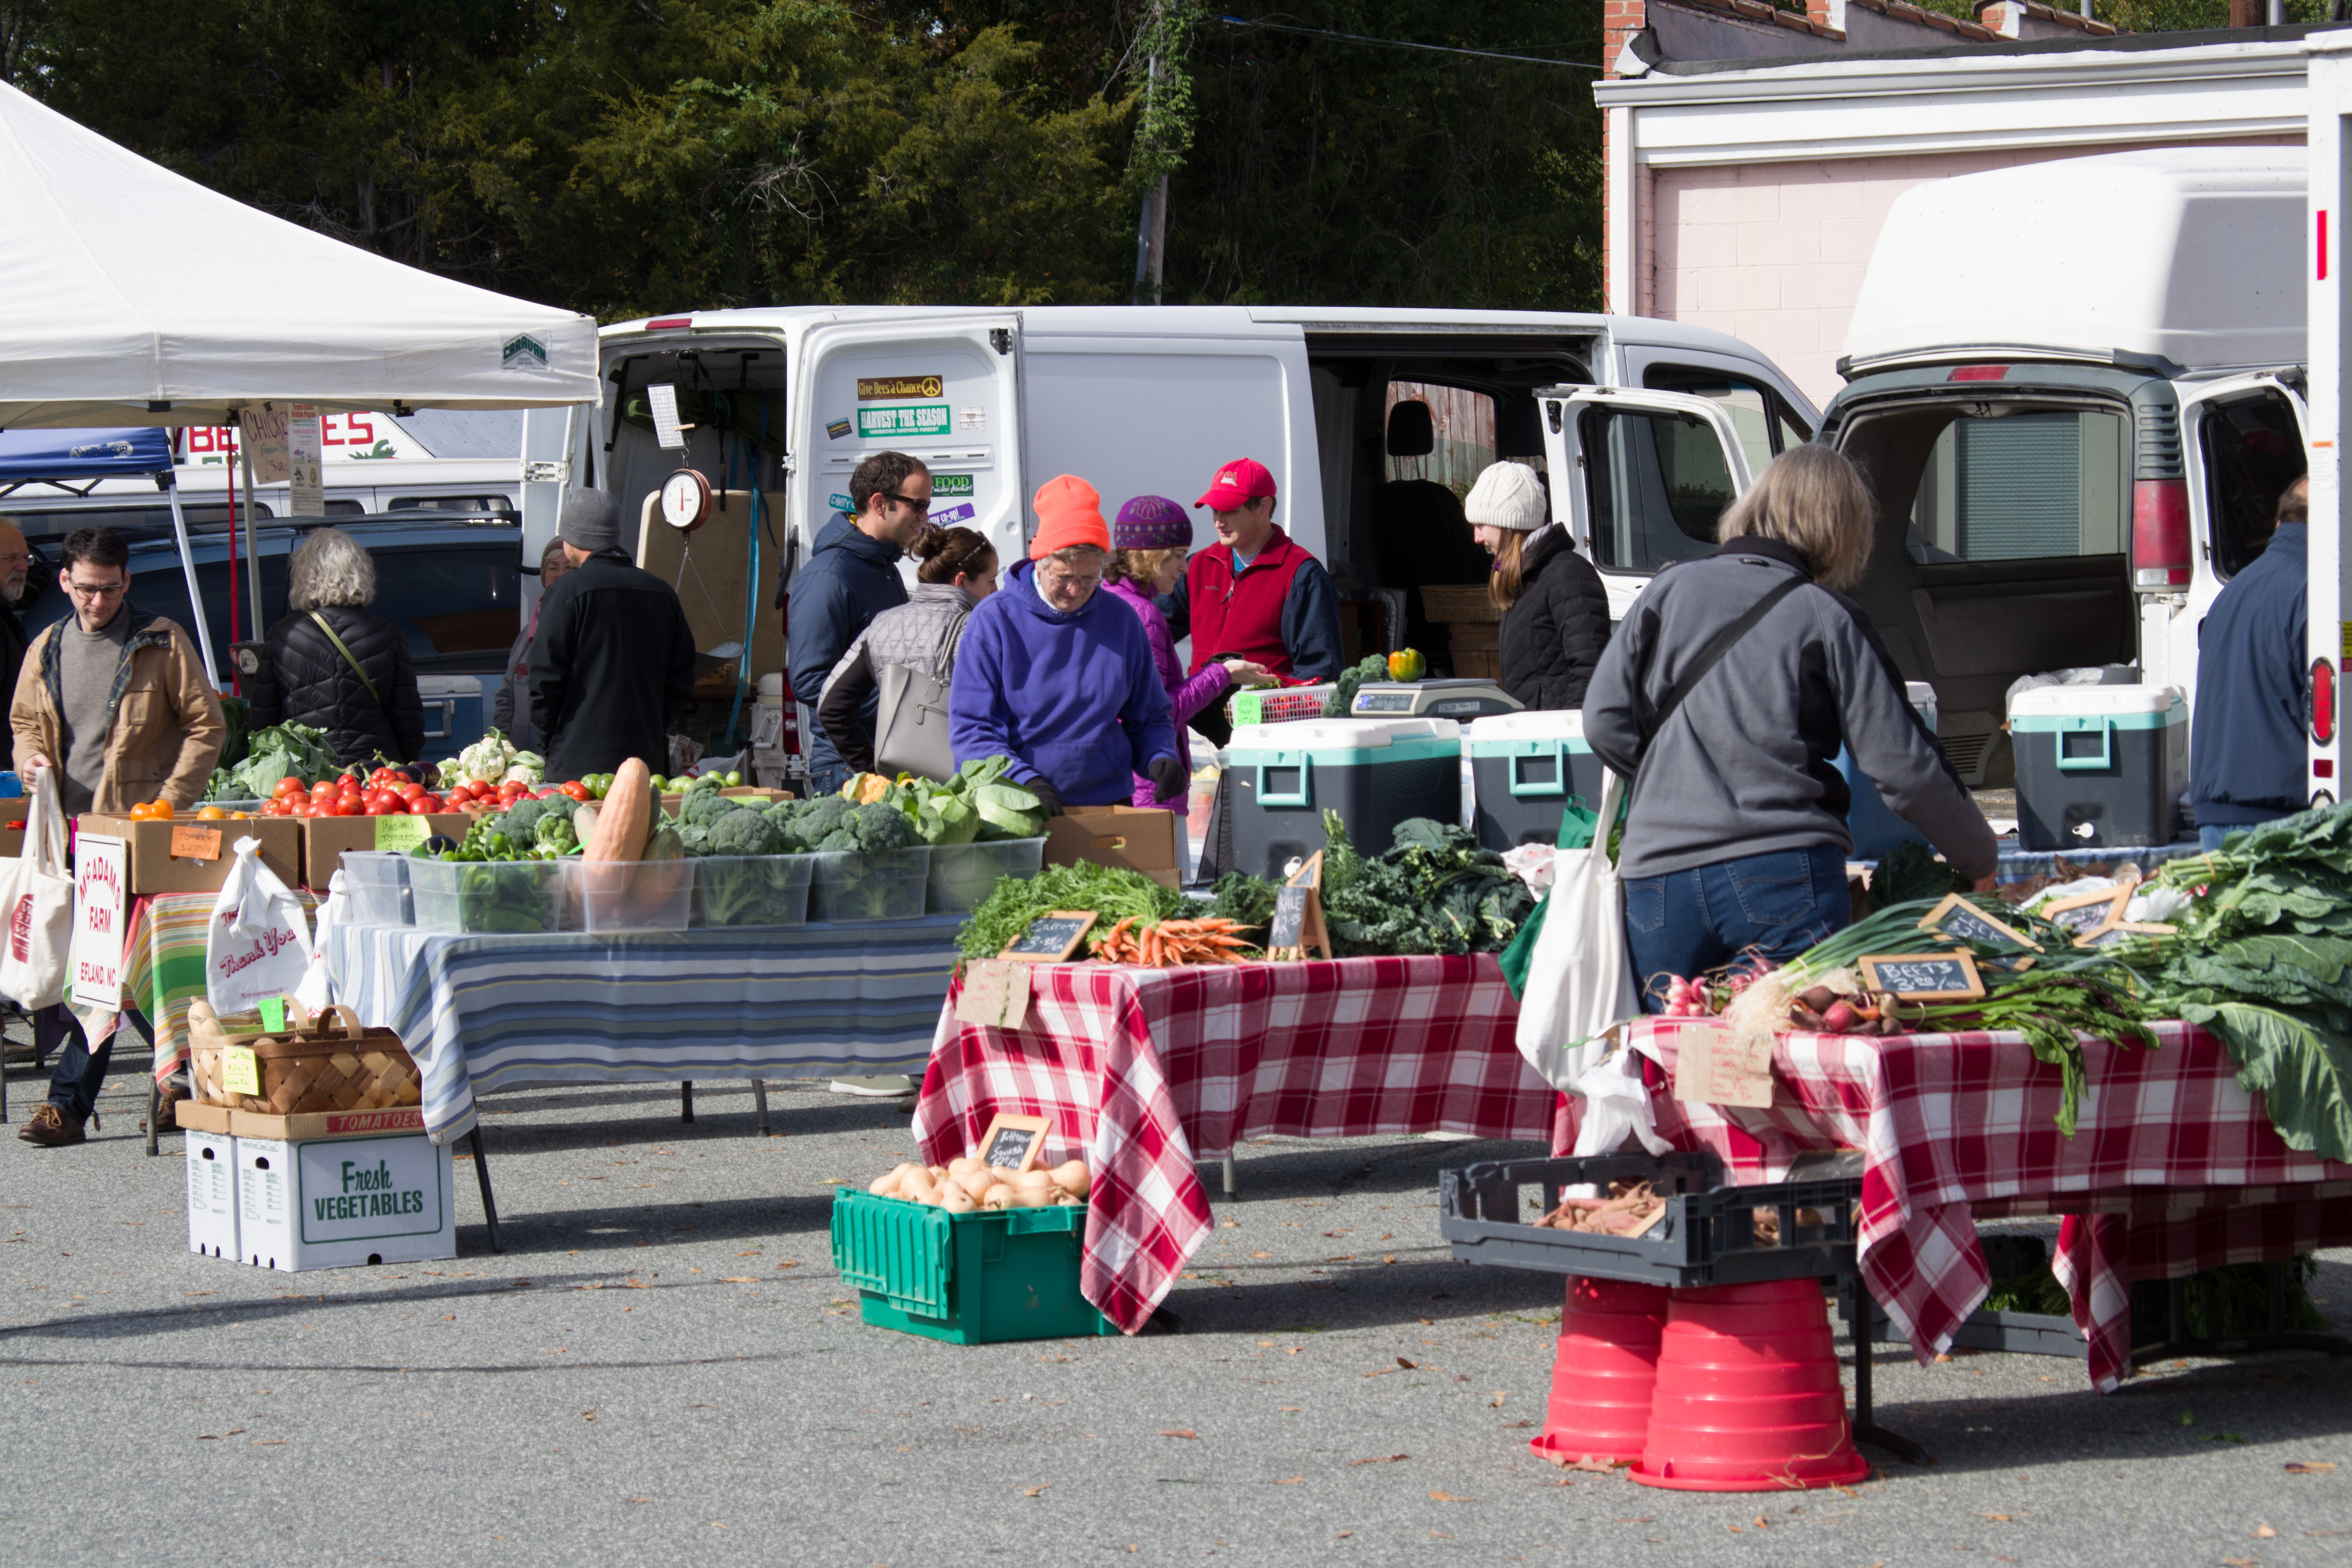
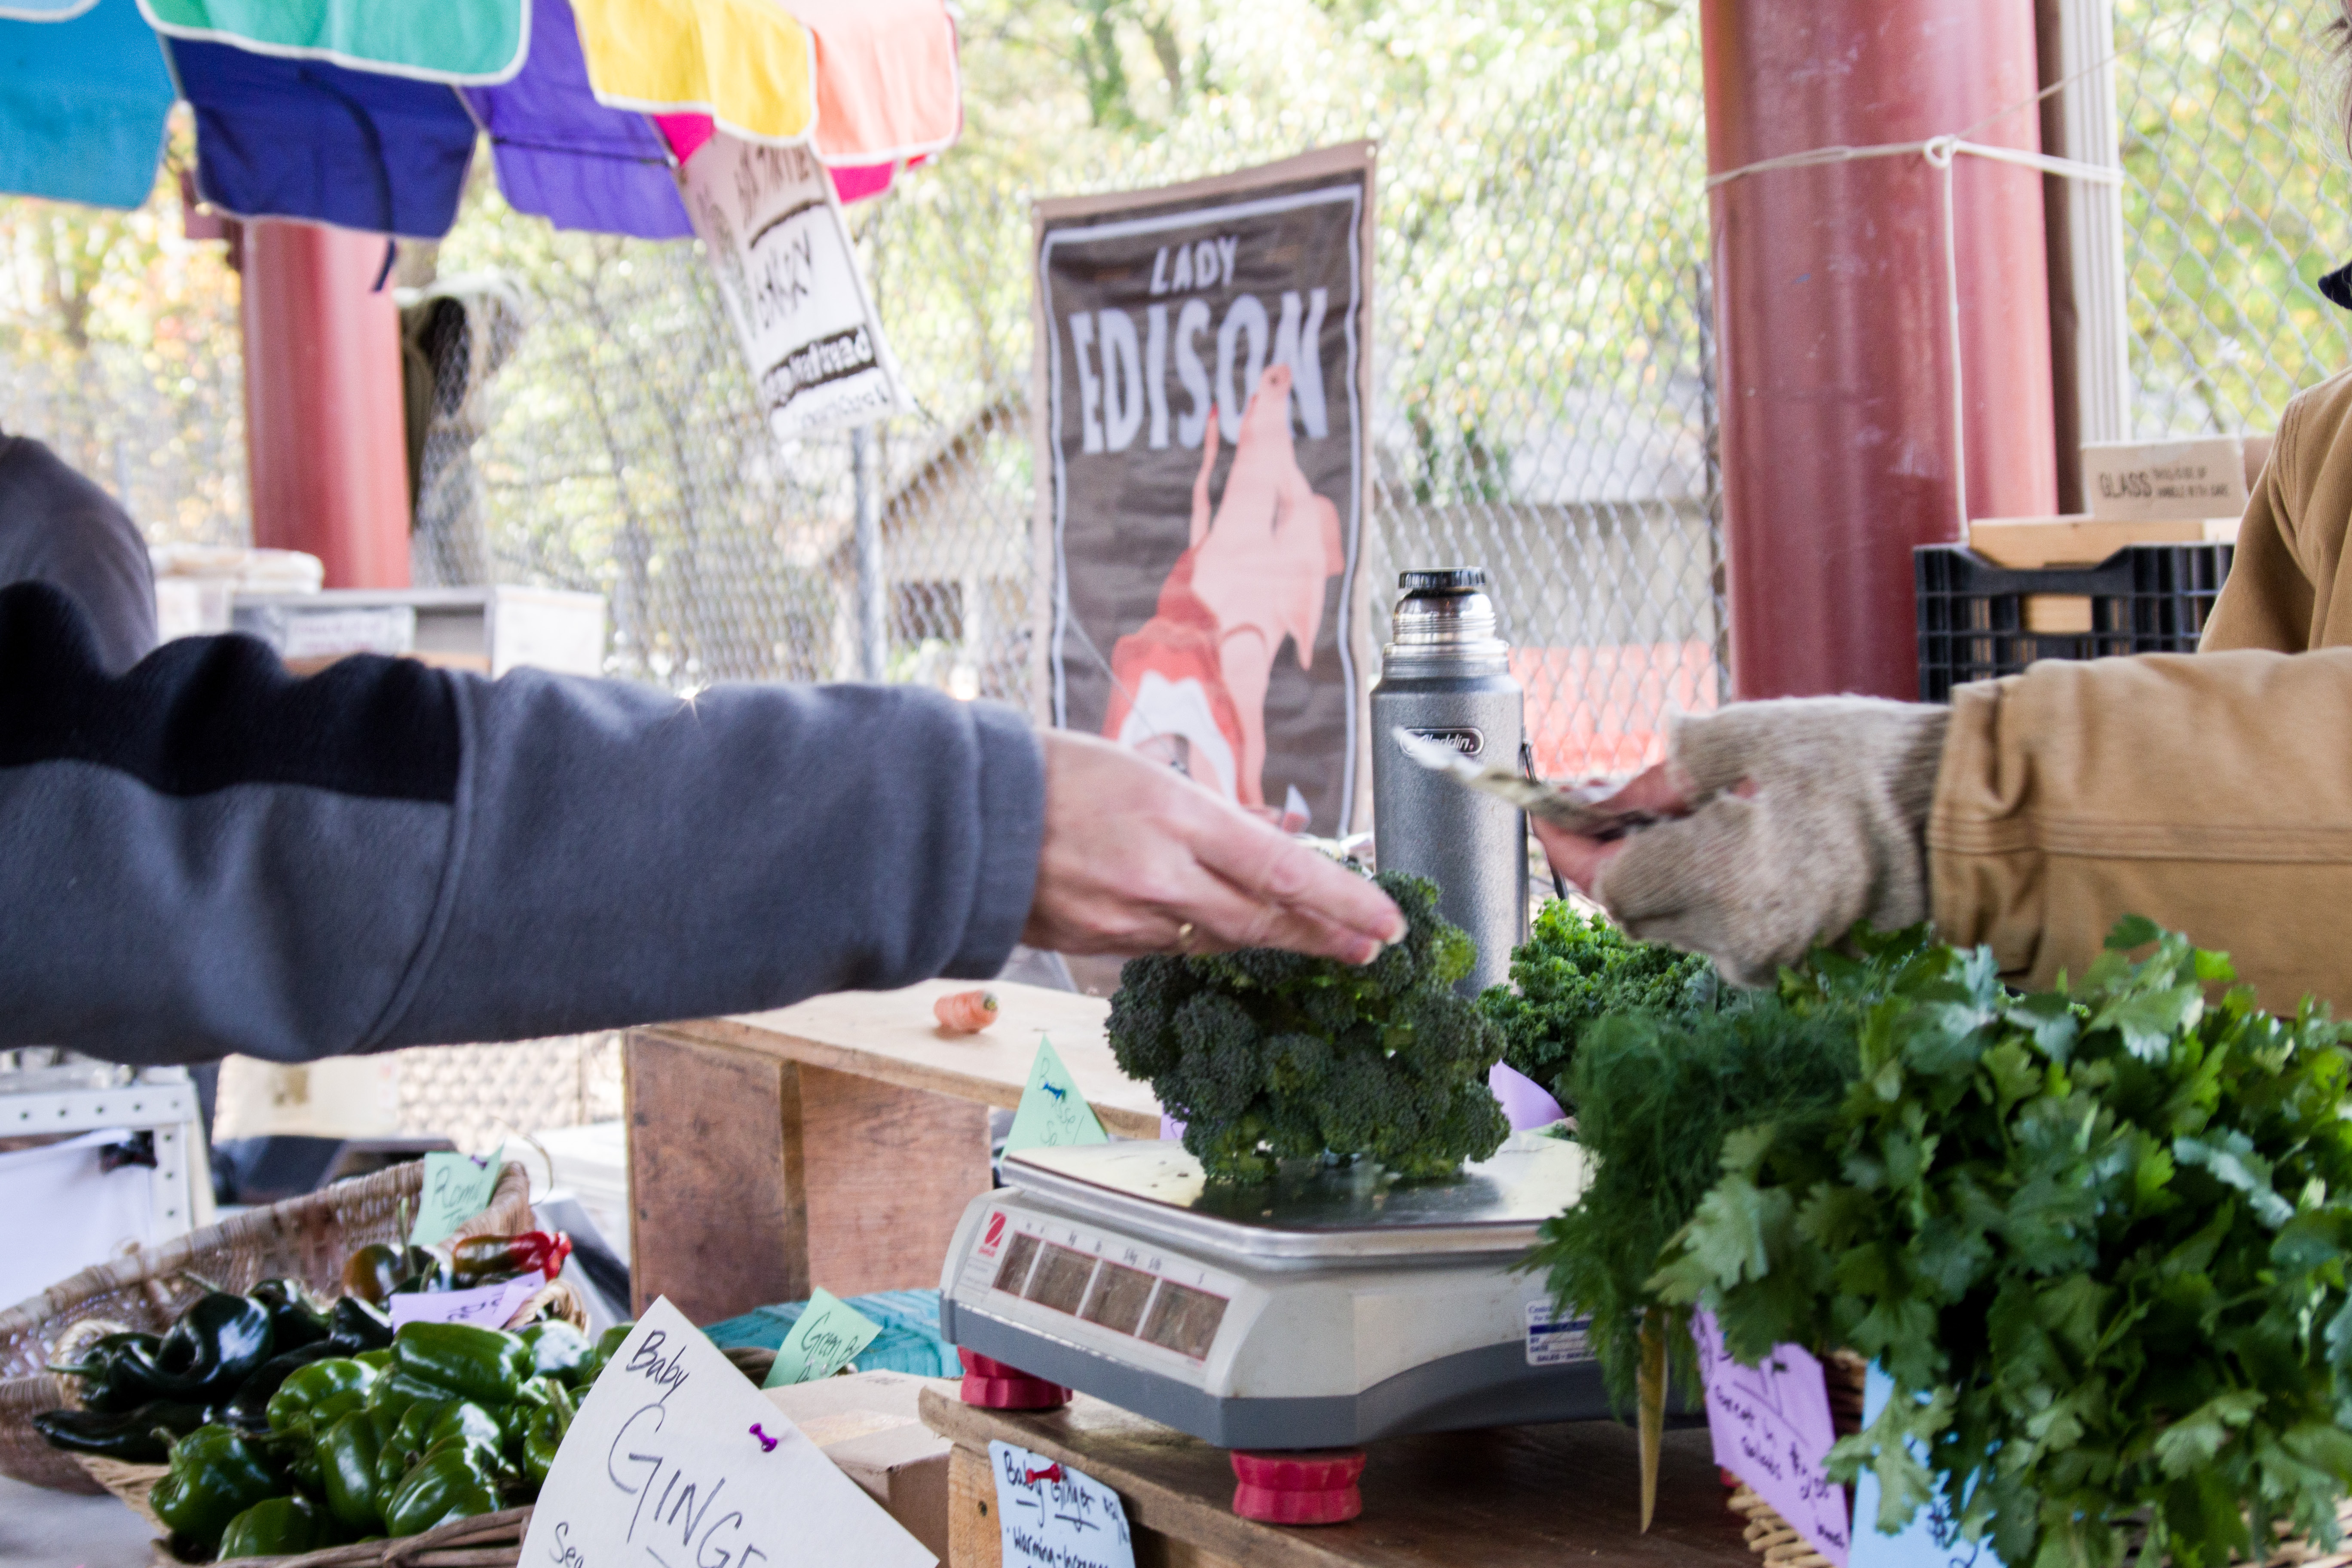
Sitka Farmer’s Market
This farmer’s market was created and operated by the Sitka Local Foods Network initially as a way to sell off the extra produce from the St. Peter’s Fellowship Farm. Over time it grew to include other local vendors as well as vendors from other parts of the region. One interesting aspect of this program is that it partnered with the Alaska Native Brotherhood and the Alaska Native Sisterhood to use part of their building and parking lot for the farmer’s market. Another is how it was adapted to accept SNAP benefits to help those at a economic disadvantage being able to purchasing healthy foods from the farmers market.
Later on the Farmer’s Market added an additional program, Quest cards, once the program realized that even with SNAP benefits, the healthy produce at the farmer’s market was too expensive. Quest cards are a Sitka initiative to encourage families who qualify for SNAP to buy healthy food from the farmer’s market. The Quest card gives the participants $1 for every dollar spent on purchase of healthy foods at the farmer’s market to encourage and enable them to buy fresh, healthy produce from the farmer’s market instead of buying unhealthy foods from convenience stores.
Garden Mentoring Program
This program run by the Sitka Local Foods Network provides education, training, and technical assistance to local organizations or citizens who want to grow their own gardens to increase the amount of food grown and harvested locally. This helps provide those without previous experience gardening with valuable resources.
Sick-A-Waste Sitka Composting Project
As a companion project to the Garden Mentoring Program and St. Peter’s Fellowship Farm, this initiative by the Sitka Local Foods Network was to create a community compost with contributions of compostable waste by community members that could be turned into compost used in community and family gardens.
Sitka Kich
A commercial kitchen for community members to use for for processing and canning the food grown, harvested, farmed, or caught locally was created through the Sitka Local Food Network partnering with: the Sitka Conservation Society, the Sitka Health Summit, the First Presbyterian Church, the Sitka Food Co-op, the Sustainable Southeast Partnership and the University of Alaska-Southeast Cooperative Extension.
In addition to offering the use of a commercial kitchen, they hold classes teaching people how to can foods such as salmon and vegetables, with the idea of encouraging individuals in the community to create a cottage food industry of healthy, locally sourced foods.
A commercial kitchen is great for supporting healthy food programs because food safety is an important aspect of healthy food, that is sometimes overlooked when healthy food programs solely focus on nutritional value and healthy diet. Without proper equipment when preparing large batches of food for sale, there is a much higher risk of contamination of the food with pathogens, leading to an increased risk of contracting a foodborne illness for those who consume the food.
Serving local fish in school lunches
Local schools in Sitka now serve locally harvested fish once a week in the school cafeterias along with a coordinating educational program for the elementary school students that came to be as a result of a partnership between the Sitka Conservation Society, local schools, commercial fishermen, local seafood processors, the school food service provider, Sitka Native Education Program (SNEP), the Alaska Department of Fish and Game (ADF&G) and the National Park Service.
A Guide to Serving Local Fish in School Cafeterias
This guide was created to help other schools in similar communities, such as those in Southeast Alaska, adopt similar programs. It provides details on the organizations and process involved with getting local fish to be served in school cafeterias as well as getting the students interested in and excited about eating the
Stream to Plate Fish to School Classroom Lessons
This document includes lesson plans, worksheets, and picture cards for teaching a program called “Stream to Plate” about the local fishing industry to get young students excited about and interested in learning more about the fish they’re eating in the cafeteria for lunch. The lessons are geared towards 2nd to 5th grade elementary school students.
Sitka Seafood Festival
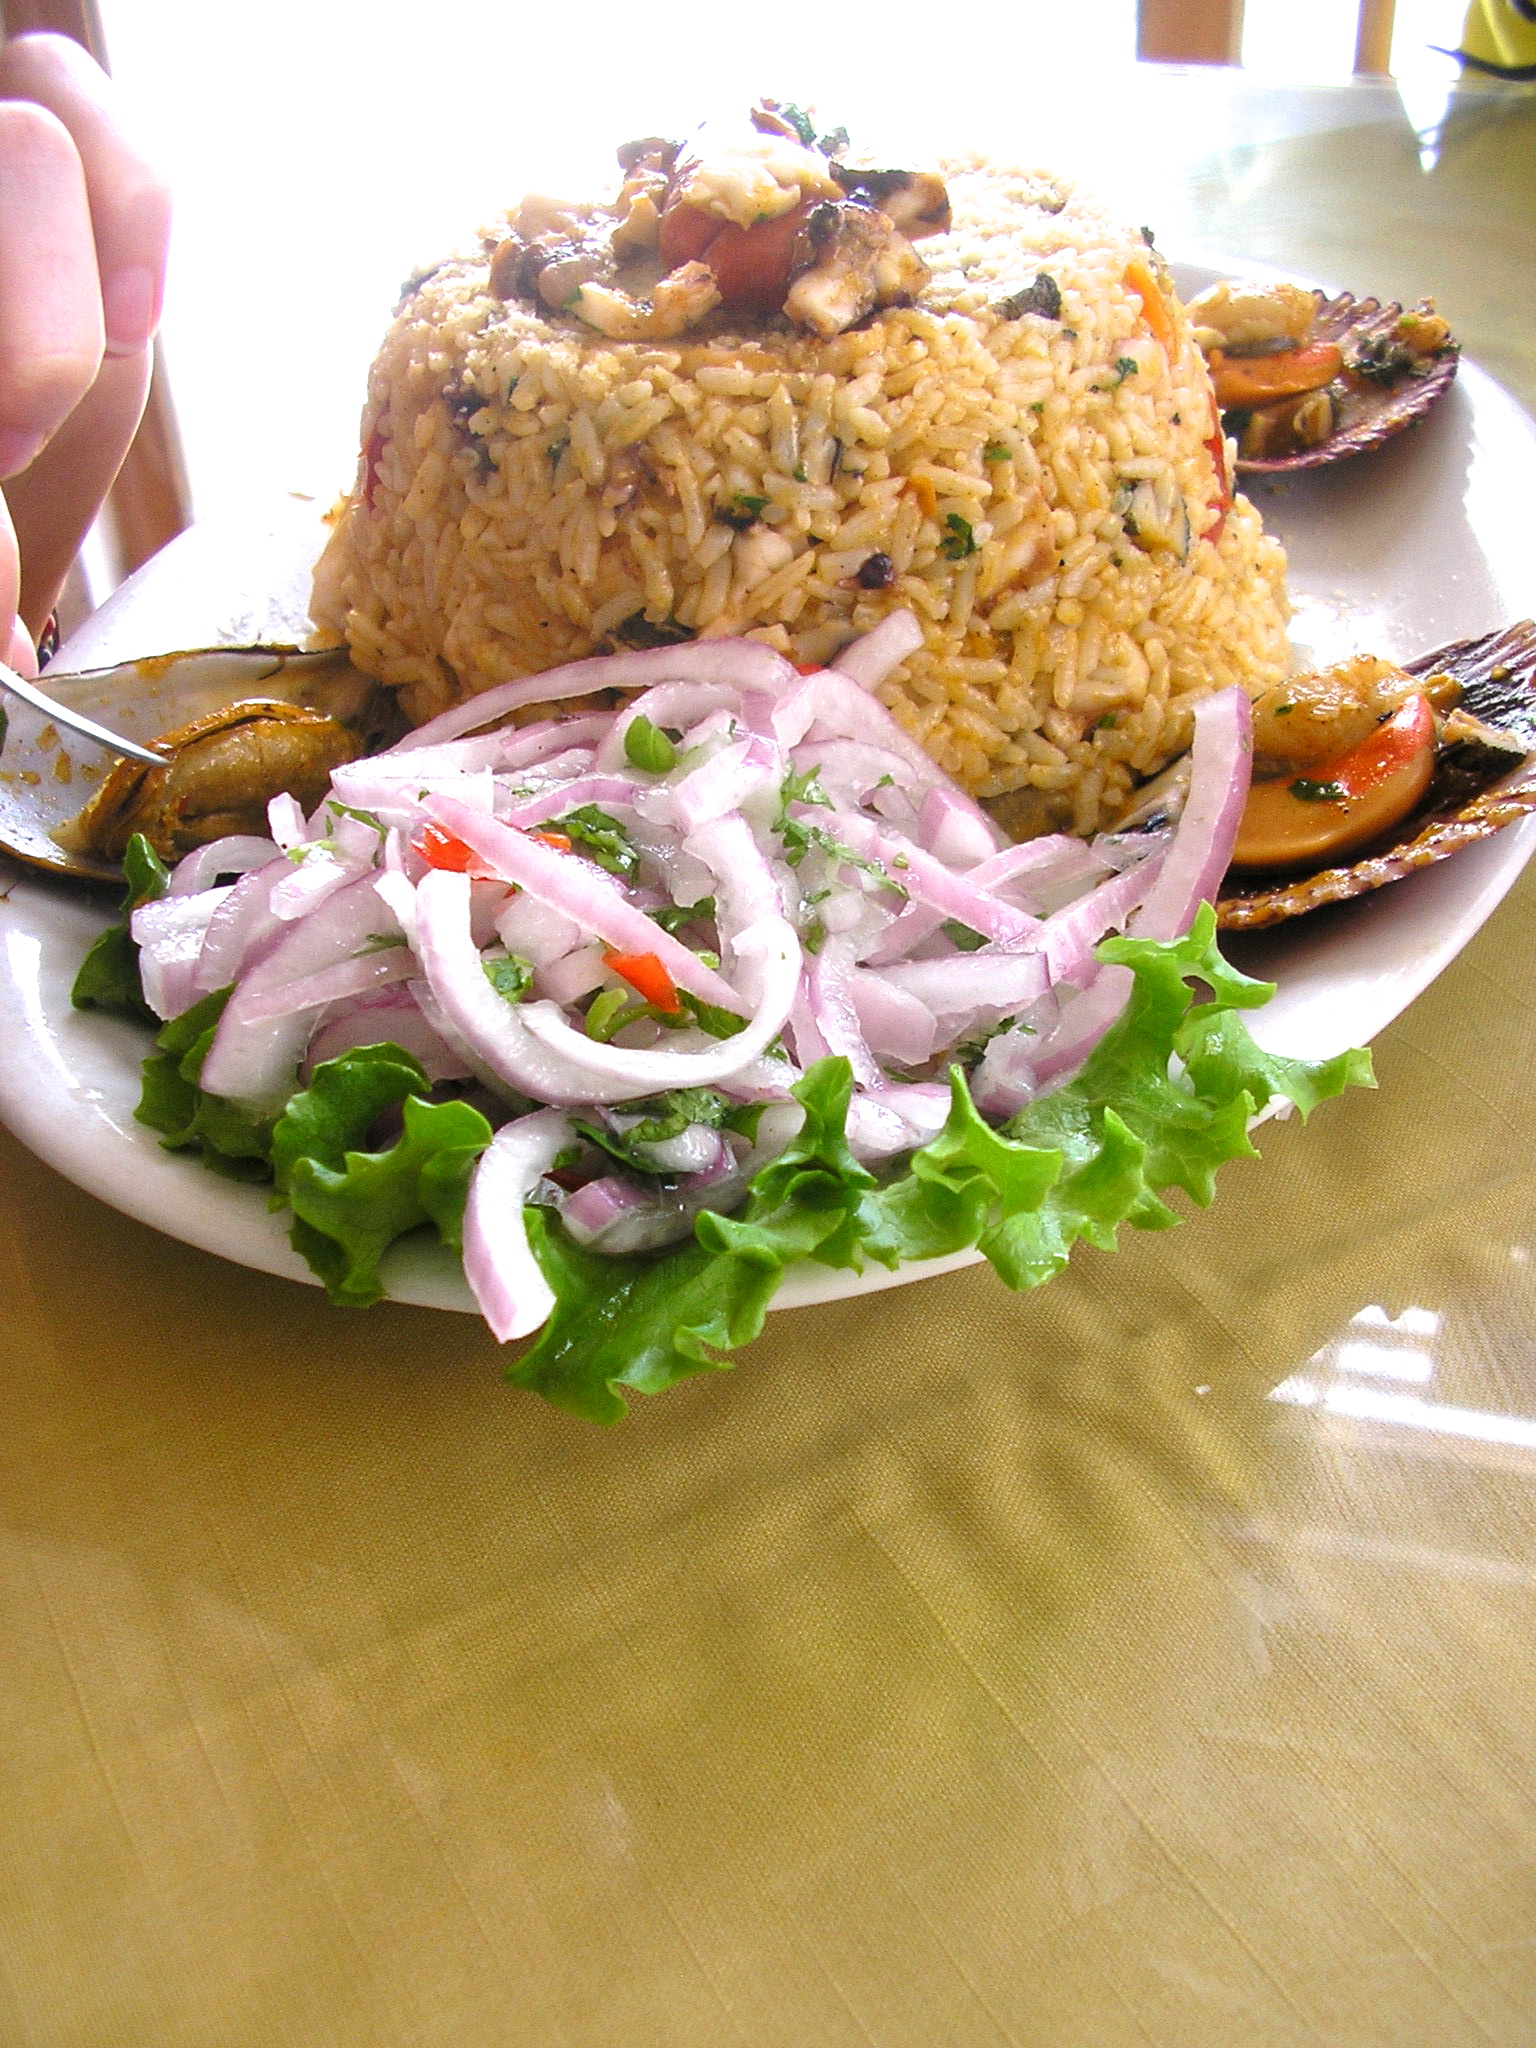
Held every year to celebrate local seafood, this festival includes a contest where people make a fish dish and judges award prizes, such as Alaska Airline tickets. Including locally harvested seafood as well as celebrating the different cultures within the community helps to emphasize the cultural importance of seafood as well as its nutritional, environmental, and economic importance.
Sharing
In addition to having some very interesting healthy food programs including a focus on health equity, the Sitka Health Summit shares information about their programs in order to inspire and inform other communities looking to start, grow, or improve their healthy food programs. One way they share about their healthy food programs is through Live Stories. LiveStories is an all-in-one data platform makes it easy to analyze local data, get benchmarks, and create interactive stories. The Sitka Health Summit’s Live Story on their healthy food programs includes interactive graphs of data such as the difference between food costs in Sitka compared to the US average, two other cities in Alaska–Juneau and Anchorage–, and two cities in mainland US — Seattle, WA, and Portland. Check out the Sitka Health Summit LiveStories page to take a look at these data visualizations and narratives.
Another way Sitka’s healthy food programs get shared with others in the public health or community development field is through discussing their healthy food programs in online webinars. Loyd Platson, with Sitka Counseling and who is on the board of the Sitka Health Summit recently told the story of and shared details about Sitka’s healthy food programs on LiveStories webinar on the topic of Healthy Food Access on February 13, 2018.
Conclusion
Partnerships with a multitude of organizations in a collaborative, community driven process, that includes a focus on health equity have created innovative healthy food programs to increase access to healthy foods in Sitka, Alaska. By looking at the example of the Sitka Health Summit’s healthy food programs other communities may be able to use ideas, lessons learned from these programs in Sitka and find ways that will help create or improve on existing healthy food initiatives in their own community in ways that may provide additional resources to those most at risk or at a disadvantage compared to the rest of the community so that more of the community can access and benefit from the healthy food programs.
Are there healthy food programs similar to these in your community?
Share a link below to a website, article, about the healthy food program so everyone reading the comments can check them out!
Jillian Regan, MPH is a consultant at Rillian. She enjoys helping organizations find new ways or evaluate improve existing community health improvement efforts, so that the organization can better serve its community members, clients, customers, patients, or other stakeholders. Connect with her by email at Jillian.Regan@RillianConsulting.com or Twitter (@JillianReganMPH) or LinkedIn.
Follow Rillian on Facebook to get updates on articles like this one or updates about current projects, like a bicycling survey!